Saturday, June 17, 2023

Circuitos. Amplificador con transistor bipolar

En este capítulo vamos a profundizar en uno de los clásicos de la electrónica analógica: El amplificador en emisor común con divisor de tensión.

Se trata de un uso del transistor NPN en su zona activa con el fin de amplificar una señal pequeña. Base de amplificadores diversos, como los de audio.


Análisis teórico

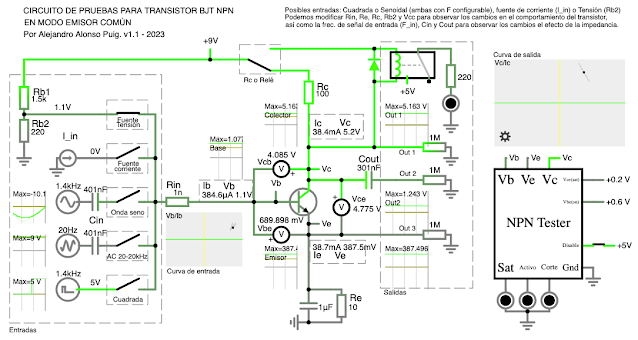
El divisor de tensión formado por Rb1 y Rb2 polariza la unión Base-Emisor con una tensión 

VB = VCC . Rb2 / (Rb1+Rb2) = 1.15V

Para que la base siempre esté polarizada, hay que tener en cuenta que la señal de entrada (Vin) se sumará a la componente continua (del divisor de tensión). Esta ha de superar la tensión de polarización mínima de la Base, incluso en valores pico negativos de señal de entrada. Es decir que:

VB + Vin(min) > VBE(on) + VE

Donde:

  • VBE(on) es la tensión base-emisor mínima para polarizar el transistor. Su valor está entorno a los 0.6-0.7V para transistores de silicio (los comunes)
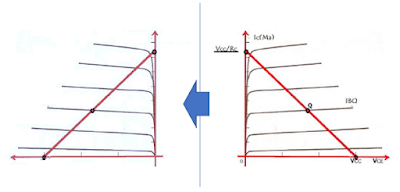
Podemos estimar matemáticamente todos los demás valores de funcionamiento del transistor en reposo (sin señal de entrada Vin), lo que nos permitirá identificar la recta de carga y el punto quiescente:

  • VBE (tensión Base-Emisor) la podemos aproximar a 0.7v. Aunque implicará un error de precisión, en la mayoría de los casos nos permitirá obtener valores bastante aproximados. 
  • VE (tensión de Emisor respecto de masa) es igual a VB - VBE = 1.15v - 0,7v = 0.45V
  • IE (corriente de Emisor) por ley de ohm es igual a VE / Re = 0.45v / 10Ω = 45mA,
  • IC (corriente de Colector) es igual IB + IE  pero IB es muy baja (ver curva característica), por lo que se puede aproximar que IC ≈ IE = 45mA.
  • VRc (tensión en Rc, o entre fuente (VCC) y Colector) es igual a Rc . IC = 4.5V
  • VC (tensión de Colector respecto de masa) es igual a VCC - VRc = 4.5V
  • VCE (tensión Colector-Emisor) es igual a VC - VE = 4.05V

    Volviendo al circuito:

    • Rc
      permite establecer (junto con VCC) la recta de carga estática, permitiendo calcular los puntos de corte y saturación. El punto Q de trabajo será la intersección de la recta de carga con el VCE calculado.
    • Re aumenta la estabilidad del amplificador, pero ha de utilizarse en paralelo con un condensador (Ce)
    • Ce es un condensador de desacoplo para atenuar componentes alternas y mejorar la estabilidad del amplificador
    • Ci y Co son condensadores de acoplo que eliminan la componente continua. Para ello han de elegirse de manera que su reactancia sea baja para las frecuencias utilizadas en el amplificador.
      La gráfica siguiente muestra como es la respuesta frecuencial de la reactancia (XC) de Ci y Co en este amplificador de ejemplo.

    Análisis en simulación

    Para simular este amplificador, utilizaremos un circuito de pruebas para transistores BJT que he desarrollado sobre el simulador de Falstad


    Se puede acceder a la simulación del amplificador en este enlace: ENLACE

    Poniendo el amplificador en reposo (desactivando la fuente de señal pero dejando la fuente de tensión), obtenemos valores

    • IB=384µA, superior a los 200µA para el punto Q calculado arriba, 
    • IC=38.5mA, algo inferior a los 45mA calculados previamente
    • VCE=4.8V, algo superior a los 4.05V calculados previamente
    • VBE=690mV, similar a los 0.7V considerados previamente

    Pareciera que o bien la simulación, o bien los cálculos son incorrectos, pero debe tenerse en cuenta que el transistor elegido en la simulación es un modelo genérico que no funciona exáctamente como el BC547 utilizado, por lo que los datos obtenidos son diferentes, pero orientativos.


    Análisis empírico

    El paso siguiente es montar el circuito y medir los valores anteriores, con un BC547 real, con el fin de comprender mejor el comportamiento del transistor.

    Una vez montado el circuito, con el uso de un polímetro obtenemos los siguientes datos en reposo:

    IB=137µA, muy diferente de los 200µA para el punto Q calculado arriba, 
    IC=38.5mA, algo inferior a los 45mA calculados previamente
    VCE=3.9V, algo inferior a los 4.05V calculados previamente
    VBE=690mV, similar a los 0.7V considerados previamente


    Comparativa

    Tenemos por tanto tres casos con resultados diferentes. ¿Cómo podemos fiarnos de la teoría o la simulación si difiere de la realidad?

    Esta es una cuestión que nos lleva a algunas consideraciones importantes: 

    1. Una simulación solo puede acercarse a la realidad si los modelos de los componentes se corresponden con los utilizados en la realidad. En nuestro caso el BC547. Al haber utilizado un modelo genérico, es natural esperar diferencias, aunque eso no quita valor a la simulación como acercamiento al comportamiento del sistema.
    2. Hemos asumido, por simplicidad, que VBE = 700mV en vez de 660mV del caso específico de este transistor. Para mejorar la precisión en este caso es recomendable inspeccionar el datasheet del componente para identificar mejor sus parámetros. 
    3. También hemos asumido, por mantener sencillo el ejemplo, que el voltaje resultante del divisor de tensión se mantiene constante (VB = 1.15V), pero esto no es así, porque al tener la carga del transistor, se produce una pequeña caída de tensión. Como consecuencia el valor real es VB = 1.12V. Esta diferencia, aunque es de solo 30mV, junto con la del punto anterior, de 40mV son fundamentalmente las causantes de las diferencias entre el modelo teórico y el empírico, aunque también hay otros elementos que influyen, como la temperatura del componente.


    Visualización con osciloscopio

    Hasta ahora hemos podido visualizar datos concretos con el polímetro, pero el osciloscopio nos va a permitir:

    • Ver y comparar las señales de entrada y salida, así como su distorsión
    • Visualizar el punto Q y la recta de carga, así como las zonas de corte, saturación y activa.

    Para la visualización de entradas y salidas, disponemos las sondas de un osciloscopio de doble canal del siguiente modo:


    Lo que nos permite ver la amplificación en tensión de la salida (señal roja o amarilla) respecto de la entrada (azul) y su desplazamiento en fase.

    Otra interesante visualización es la de la recta de carga y punto Q. Para ello utilizaremos un osciloscopio de doble canal, que permita modo XY y lo conectaremos según se muestra a continuación. Es importante asegurarse que la tierra del osciloscopio no coincide con la masa del circuito amplificador para que esta disposición funcione.


    Una de las sondas permite medir el valor de corriente IC (a traves de su relación con la caída de tensión en la resistencia shunt) y la otra sonda permite medir el valor de VCE (aunque invertida por tener ambas masas del osciloscopio compartiendo punto central, algo necesario porque dichas masas no están aisladas entre si) Por esto, visualizaremos la información como si aplicásemos un espejo vertical.


    De esta manera, se muestra tanto el punto quiescente (Q) como la recta de carga en el cuadrante superior izquierdo del osciloscopio.


    Distorsión de la señal amplificada

    Finalmente podemos observar los efectos de la distorsión de la señal cuando entra en zona de corte y saturación. 

    Para ello no tenemos más que sustituir Rb2 por un potenciómetro y mover este para alterar la tensión sobre la base y por tanto su corriente IB, lo que desplaza la señal de salida por la recta de carga arriba y abajo. Esto es algo que observaremos tanto en el osciloscopio en modo XY como en el osciloscopio que nos muestra la señal de salida, ya que esta quedará distorsionada.


    Concluímos así este análisis teorico-práctico del comportamiento del transistor bipolar en modo emisor común, para aplicaciones de amplificación.

    Se muestra a continuación el vídeo explicativo completo.


    Tuesday, June 13, 2023

    Circuitos. Simulación de transistores BJT

    Comienzo una serie de posts sobre circuitos electrónicos, en el que pretendo explicar, esta vez en español, el funcionamiento de algunos montajes, con una cobertura muy completa, que pasa por la explicación teórica, la simulación, el montaje y el análisis con instrumentación de laboratorio.

    Hoy comenzaré mostrando una herramienta que considero de gran interés para la simulación de transistores BJT en modo emisor común. Se trata de un circuito configurable, que he desarrollado sobre el simulador de Falstad. Es un circuito que permite seleccionar múltiples entradas y salidas, así como múltiples valores para los componentes, con el fin de probar diferentes circuitos basados en transistores BJT. Permite además ver con detalle todas las señales que circulan por el circuito, así como la curva de entrada y de salida, pudiendo visualizar la recta de carga, punto quiescente y estados del transistor (corte, saturación, activo). 


    Con todo esto, podemos simular circuitos de amplificación, seguidores de tensión, circuitos de conmutación, etc. Una herramienta útil para comprender mejor el comportamiento del transistor y evaluar el comportamiento de circuitos basados en el tran
    sistor bipolar.

    Se puede acceder al circuito de simulación en este enlace: ENLACE

    Además, en el siguiente vídeo se puede encontrar un tutorial se de funcionamiento.


    Friday, September 30, 2022

    AMR-One. 05 Project Management Plan

    This is the fifth on the series of posts about the AMR-One Project. Today it is time to talk about what is a Project Management Plan, how to prepare it, and its application to the AMR-One project.

    The Project Management Plan is defined as the document that describes how the project will be executed, monitored, controlled, and closed.

    But... we already talked about it in my previous post The Project Management Plan. But the important thing is how you prepare it and why. For that, I used the AMR-One Project example and prepared the following video that I hope you like:


    Wednesday, August 31, 2022

    Interview: Technological Startups

    I was interviewed recently about challenges and recommendations for Technological Startups. Although the interview is in Spanish, I share with you the written translation of the interview in English. Also, the video may include English and Spanish subtitles if you like.


    Click to watch the interview


    Good morning Alejandro, On this occasion and taking advantage of your experience as an advisor to technology startups, we would like you to tell us a little about the challenges that a startup of this type faces.


    A technology startup faces multiple challenges. Perhaps the most important of all is to understand the customer and the market, but there are of course many other challenges, such as identifying the right product or service, knowing how to shape and industrialize it, finding investment, correctly designing and executing the marketing and sales strategy, or just grow.


    Could you give us some guidelines that a technology startup should take into account in its first steps?


    The Market

    The first thing is to select the market in which to operate. It has to be interesting, fun, and motivating for entrepreneurs.

    You need to know the sector and the client very well. Do it first-hand, not just from third-party reports.

    It is also necessary to take into account cultural, idiomatic, usability aspects, barriers, competitors, regulatory aspects, registered patents, etc.


    The Product

    On the other hand, there is the product or service. This must be focused on the client and their needs. In many cases, the form of the product is more important, that is, the contribution of value that the customer perceives from the product than the product itself.

    It is recommended to start with a minimum viable product. In other words, to get basic results with the minimum investment in time and cost, that allow the product or service to be tested in the target market.

    Sometimes the entrepreneur focuses on making a product with a very high technological contribution, investing too much time with its associated opportunity cost, when the priority may be to verify if the market is really willing to pay for that product or functionality.

    One of the techniques that is usually recommended is that of "validated learning", which consists of testing assumptions about the interest of customers, aspects that we believe are important to them and perhaps not, and measuring our progress in some way, not by the sales made, but through learning, which is what brings us closer to finding what meets the customer's need or desire.

    When Thomas Edison invented the light bulb, it did not work out the first time, but he made more than a thousand attempts, to the point that one of his collaborators asked him why he persisted in building a light bulb if after more than 1000 attempts he had not succeeded. Edison replied: They are not failures, I learned 1000 ways of how not to make a light bulb.

    But you also have to know how to make the decision to persevere or pivot your strategy.


    Escalability

    The product or service must be scalable, that is, if it is successful, scale factors can be applied, such as offering more units to cover the market, creating accessories or adding functionalities.

    There must be a multiplier factor that turns the startup into a money-making machine when the time is right.


    Business Plan

    A good business plan is a roadmap. You have to be honest and consider alternatives.

    The plan must analyze all the critical aspects of the business: the market, the value proposition, the team, the marketing and sales plan, the growth plan, the financial plan,... and of course a Plan B in case things do not go as expected.


    Financing

    To obtain financing, a startup can go through crowdfunding processes, search for business angels, and many other investment models, but in order to access this investment, the business model must be prepared very well, demonstrate that the idea has passed a certain validation of the market, that it is scalable and that the correct team is available, not only technical but also experienced advisors who mentor and accompany the company not only in its initial start-up but also during its journey and growth.

    We already know the Chinese proverb: "If you want to go fast go alone. If you want to go far go together".

    Tuesday, August 30, 2022

    AMR-One. 04 Work Breakdown Structure (WBS)

    This is the fourth on the series of posts about the AMR-One Project. Today I will talk about the Work Breakdown Structure tool as a way to get the tasks of a project.


    The concept

    Once we have somehow the scope, requirements, or definition of what we are going to do, we could prepare the Work Breakdown Structure (WBS).

    The Project Management Institute (PMI) PMBOK defines the WBS as a “deliverable oriented hierarchical decomposition of the work to be executed by the project team.

    Basically is an iterative process that takes one large work product, and breaks it down into smaller, manageable work packages.

    In a WBS such elements are the items that are estimated in terms of resource requirements, budget, and timing


    WBS applied to AMR-One Project


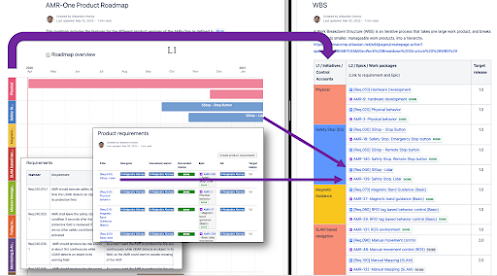
    In the case of AMR-One, I made a simplification of the process, aligning the Product Roadmap, the Requirements, and WBS.

    So in the WBS I added all Initiatives from the Roadmap as L1, and the Features or Epics as L2. Also I added one column to define the version of the product where these Epics will apply.


    WBS related to Roadmap and Requirements


    I didn’t split it into more levels as in this way it is quite aligned with the requirements already defined.

    Now from here, and having the architectural approach mentioned in the previous video, we could start identifying atomic tasks within each Epic. This is work to do with the technical team, identifying dependencies, resources, time, and cost estimation.


    Epics decomposition in atomic activities


    And that is all so far. 

    In the next post, I will explain to you how to prepare a good Project Plan. It is not only to have a plan of tasks, time, and costs. It is much more than that!

    See the following video for more details:


    Saturday, July 30, 2022

    Interview: AGVs and AMRs in the Industry 4.0

    I was interviewed recently about what the AGVs and AMRs are, and why they are so important for the industry. Although the interview is in Spanish, I share with you the written translation of the interview in English.


    click to see the interview (in Spanish)


    Could you explain what automated intralogistics vehicles are and what they are useful for?


    There is no doubt that the industry increasingly requires to operate in an automated way, otherwise, it could not serve the growing demand of the market, while reducing costs and improving the quality of the products and processes.

    One of the ways to go in this direction is to use what are called automated intralogistics vehicles, which can move material completely unattended.

    I'll give you two examples:


    Case 1: Automotive manufacturing

    The first example is in the automotive sector, where car assembly lines operate continuously and therefore require a constant flow of parts from what is called the kitting area, which is where the parts are located, to the assembly area. In this case, the automated vehicles deal precisely with this task without pause, communicating and interacting on their way with different elements of the factory such as doors, elevators, robotic cells, and even people if needed.

    Case 2: Online Shopping

    Another example is that of the orders we make online to Amazon, Zara, or Aliexpress, among others, in some cases with delivery times on the same day. This would be impossible without automation.

    In this case, your order enters the web and from here it enters the supplier's order and warehouse management system. These systems are connected to a Fleet Management System, which manages the dozens or hundreds of automated vehicles that will pick up the products of your order and take them to the picking area, where the operator or even a robot introduces them into the box that then arrives at home.

    In all this process there are a lot of technologies involved, such as artificial intelligence algorithms, perception systems, artificial vision, etc.


    Could you briefly tell us about the difference between the two types of automated vehicles you mentioned: AGVs and AMRs?


    AGVs, an acronym for Automatic Guided Vehicles, normally follow a band on the floor, which is like a road with forks. It is a very proven and very safe technology to drive the vehicle along fixed routes.

    While the AMRs, acronym for Autonomous Mobile Robots, do not require these bands, using other sensors, such as laser scanners or artificial vision based systems and have a greater decision-making capacity, such as to avoid a person or decide the best route to reach a destination.

    The important thing is to choose the technology that best meets the needs of the industry in each case.


    Friday, July 29, 2022

    AMR-One. 03 Architecting the solution

    This is the third on the series of posts about the AMR-One Project. Today I will talk about architecting the solution.

    In the previous post I described the requirements, so we know now what are the functions that the system should accomplish. But before defining the tasks to accomplish these requirements, we need to have an idea of how are we going to build the solution. For that, some people tend to create more technical requirements, in the language of the developers. I prefer to spend some time working on a pre-design of the whole system, from the mechanical, electrical, and software sides, involving representative people from each of the disciplines. It is essentially an iterative process, but having a basic architecture already opens minds to understand the tasks needed to build the system. 

    When we have this general pre-design of the system, we could go further on the class definition for SW, materials for mechanics, or technologies for hardware.

    Let's see as an example how this architecture has been defined in the AMR-One project.


    The AMR-One case

    As we saw in the episode about the roadmap, there are at least two versions of the product, with different functionalities. But we will consider the mechanical, hardware, and software approach for both versions 1.x and 2.x.


    The mechanical approach

    The mechanical approach starts with an overall analysis of the kinematics of the needed system, then continue with some freehand sketches and then with some draft ideas using some computer tools, but not going in deep on the design.

    The hardware architecture

    The hardware and electrical architecture define the components (sensors and actuators) but what is more important, helps to define the processing systems and the functions assigned to each of them. (click on the image to see it bigger)


    HW architecture


    We define 4 processing systems: 

    • Safety PLC (Flexisoft)
    • Low-level controller (LLC)
    • High-level controller (HLC)
    • Cloud base system

    Going a bit further on the functions assigned to them we have that:

    • The Safety PLC is responsible for ensuring the safety measures are executed reliably. It uses several inputs (Safety Lidar and safety stop buttons) to determine when there is a dangerous situation and the system should stop. There is therefore a program inside this PLC to ensure this behavior.

    • The Low-Level Controller (LLC) is responsible for the Low-Level functions, which are the following:
      • Sensory reading
      • Traction motors PIDs controls
      • Velocities (linear and angular) conversion into inputs for the PIDs controls
      • Magnetic guidance
      • RFID tags reading and execution of actions
      • Pinhook control
      • Buzzer control for warnings
      • Device HMI data
      • ROS publisher to connect with HLC/Cloud Monitoring
      • ROS publisher/subscriber to connect with HLC/ROS navigation (AMR-One v2.0)

    • The High-Level Controller (HLC) is responsible mainly for:
      • Communication with the LLC
      • Communication to the cloud
      • User interface (AMR-One v2.0)
      • Localization, navigation, and mapping based on ROS (AMR-One v2.0)

    • The cloud-based processing system is not described in the hardware architecture because it would not require additional hardware from us.

    The software structures

    As mentioned, there are four processing systems, each of them with programs inside. 

    The structures are quite self-explanatory. Only to mention that the items with yellow background correspond to v2.0 of the project and the rest correspond to v1.0 (click on the images to see them bigger)


    See the following video for more details:


    Now we know how to approach the solution and we are prepared to work on building a Work Breakdown Structure to define the Epics and tasks of the project, but this will come in the next post.